The histogram is a graphical representation of an image’s tonal values, luminosity, or brightness. At a glance, it can tell you if an image is too dark or too light. It accurately plots the number of pixels for each tonal value, from zero (pure black) on the left to 255 (blank white) on the right. It tells you whether your image is properly exposed, and, if not, what adjustments need to be made. Understanding and using histograms, both at the point of exposure and later in post-processing, will enhance and improve your skills as a photographer.
My background was all in analog (film). We had no histograms. We were mostly eyeballed. I will freely confess that the first time I saw a histogram I had no idea what it was nor its value. For the longest time, I pretty much ignored them. My pictures were coming out. Histogram, schmistogram.
When I finally got some information on them, the scales fell from my eyes. I not only realized the value of histograms, but I realized that they are stupidly simple to interpret. They are wonderful at the point of exposure, and even more wonderful in post-processing. They are equally useful whether you shoot JPEG or RAW (although I strongly recommend you shoot RAW if you are not already. JPEGs are exposure critical, especially overexposure, so knowing how to read and apply your histograms can save you from blocked shadows with no detail and/ or blown or blocked highlights. Shooting RAW, you have much more “wiggle room” for errors, but if you pay close attention and make good exposures, your photography will be both simplified and enriched.
In this short article, we will cover the following:
- What is the histogram?
- Interpreting the histogram
- Histograms that are atypical
- What about the camera histogram at the point of exposure?
- What about underexposure?
- Where is the histogram most valuable in your workflow?
What Is a Histogram?
A histogram is not mysterious. It is just a graph showing the tonal range of an image file from darkest on the left to brightest on the right. The X (horizontal) axis represents the tonal variations, while the Y-axis represents the total number of pixels in that particular tone. The more pixels, the greater the luminosity and brightness of the tone. A low hump may indicate a less brilliant picture overall. Increasing contrast will make the hump higher.
Interpreting the Histogram
An “ideal” histogram barely touches both the left and right lower corners of the “walls” of its box. The ends should neither gap nor spike up the sides, and there should be an arch around the middle of the graph. But that is a theoretical ideal that may not work for every situation. In the real world, there is no ideal histogram, but the histogram above is one from a fairly normal scene that is properly exposed and comes pretty close to the “ideal.”
A histogram shows whether a picture has a “long scale,” from solid black (no discernible detail) on the far left, to pure white (no discernible detail) on the right, but bear in mind the absolute black and white are points, not areas.
The hump in the middle represents the mid-tones. A well-exposed average picture’s histogram should generally just touch the lower-left corner of its frame, rise gently in the center, and then descend to just touch the lower-right corner of the box. The histogram example above shows me that the corresponding photo is properly exposed and processed.
A histogram is not mysterious. It is just a graph showing the tonal range of an image file from darkest on the left to brightest on the right.
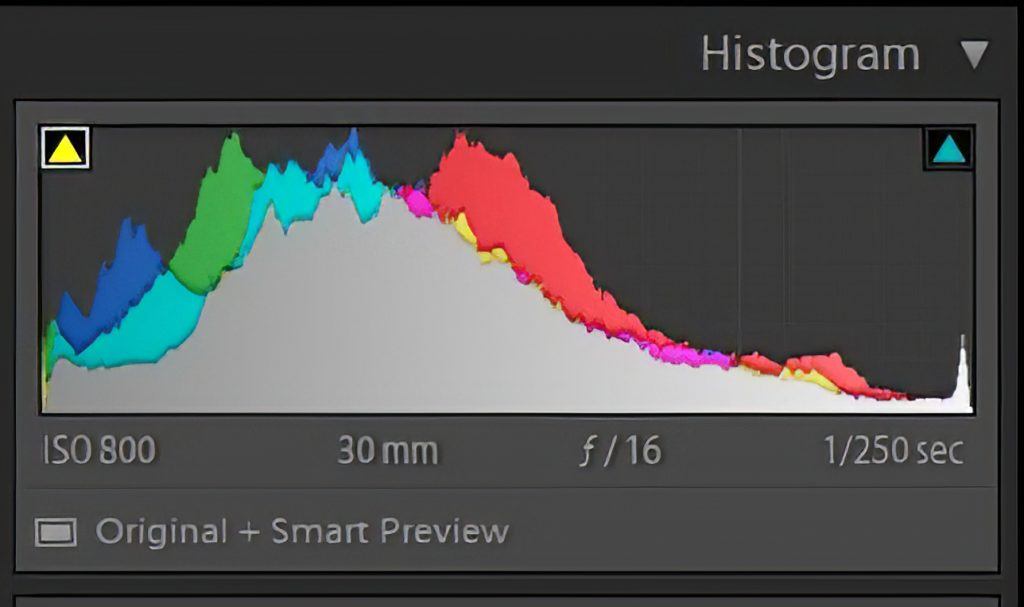
This is a screenshot from the Develop module in Lightroom. The histogram is in the upper right. You can turn it off, but I always keep mine visible. Screenshot by Charles Haacker
I won’t discuss the color channels in a short guide. You can see that they are RGB, so they are showing the values and luminosities of the separate colors. My main use for the histogram is judging exposure and balance. I was trained in black and white wet chemical photography and learned how to use the Zone System developed by Ansel Adams and Fred Archer in 1939.

A black-to-white gradient for the Zone System article by Wikipedia. Permission Details: Licensed under the GFDL by the author; released under the GNU Free Documentation License.
The principle of the Zone System is simple—render light subjects light, and dark subjects dark. A well-exposed and printed photograph should have a true, maximum black point; a true maximum white point; and a smooth gradation of nine zones of density in between. This holds equally in color.
Bear in mind, though, that photography is an art as well as science. I am—perhaps
ill-advisedly—prone to taking a somewhat rote, mechanical approach to my photography. My interpretations are usually clean, sharp, punchy, and colorful, but those attributes do not always feature. They may not always be appropriate to the subject.

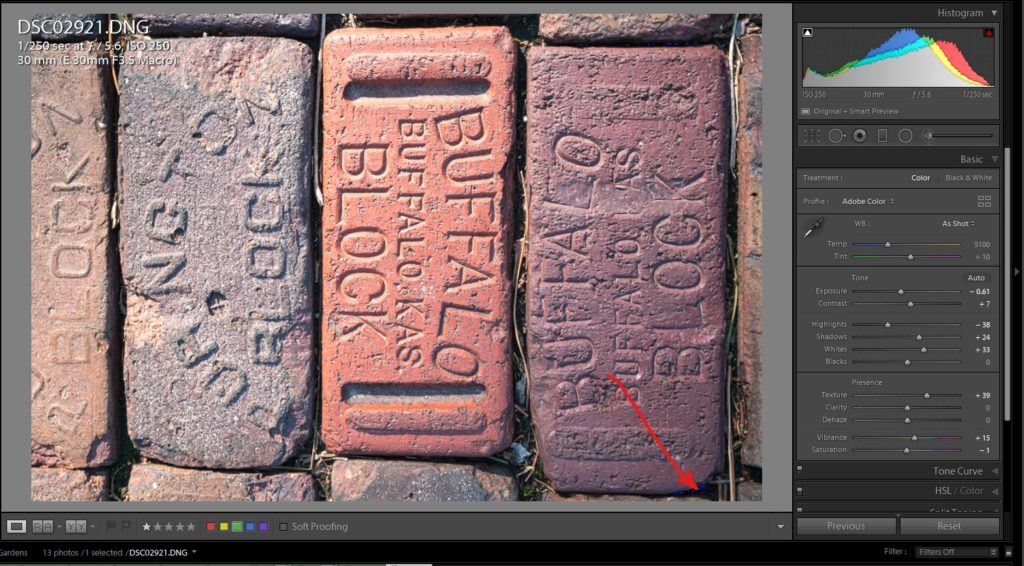
Shooting in color, I still adhere to the Zone System. The red arrow here points to a barely-there blue clipping indicator that shows the picture has an absolute black point, but only a point. Screenshot by Charles Haacker
When I process in Lightroom, I like to keep the “clipping indicators” (the little triangles in the upper left and right of the box) turned on most of the time. Clipped (no detail) shadows show up as blue areas; clipped highlights are red. I can see any clipping at a glance if greater than a point.
Histograms That Seem “Atypical”
Screenshot by Charles Haacker
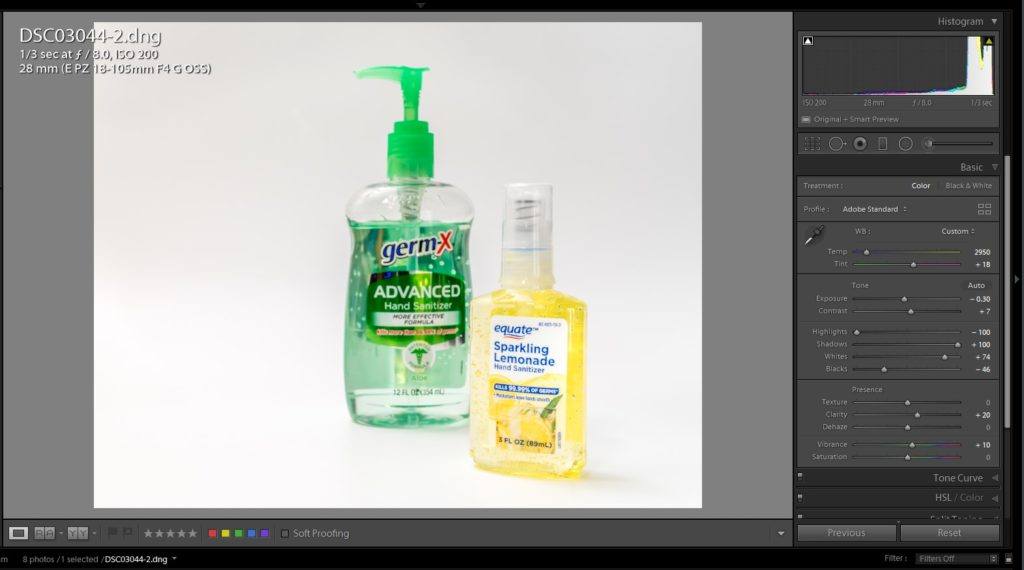
I made this picture specifically for this short guide. The image above is the final version, a RAW capture normally exposed and processed in Lightroom. The screenshot shows the Lightroom develop settings on the right. At the top right is the histogram.
Look at the picture; it has a good scale, good color, a slightly graduated background from dead white at the base to a barely-there gray above. It’s a fairly simple tabletop product shot.
But wait. That looks nothing like a “normal, ideal” histogram, yet the picture appears normal. What’s up with that? Well, what’s the most noticeable feature of the photo? It’s very light overall, right? The histogram confirms what we can see: nearly all the tones in the histogram are piled up on the right, bright side of the box.
The principle of the Zone System is simple—render light subjects light, and dark subjects dark.
Let’s get a read on that “abnormal, atypical” histogram.
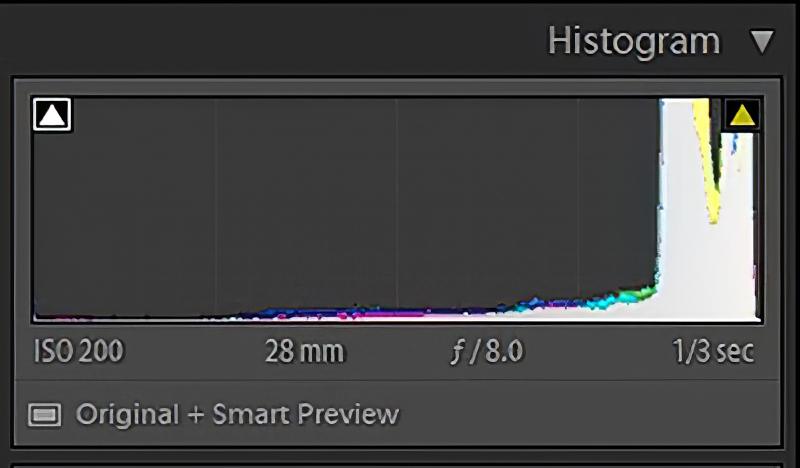
Almost all the tones in the picture are on the right, bright side of the box. The white clipping indicator is barely lit with a little yellow triangle. In the picture itself, you won’t be able to find any blue or red evidence of clipping, but we know from the lit indicator that the whites are truly white (I sound like a detergent commercial). Screenshot by Charles Haacker
Look at the dark end of the histogram in the screenshot above. The black clipping indicator is lit, barely, but there. It tells me that somewhere there is a black point, ensuring that the picture has all the scale possible, called “long scale.” The remainder of the tones and colors in the picture are represented by that very shallow sloping ramp going down leftward from the brightest tones to the barely-there black point in the left corner.
This is not an “abnormal” histogram at all. It accurately represents the actual values in the picture. There is nothing wrong with either the picture or the histogram. I could pull the exposure down to get a more “normal” bell curve histogram, but then it would look terrible, dark, and flat.
What About the Camera Histogram at the Point of Exposure?
Screenshot by Charles Haacker
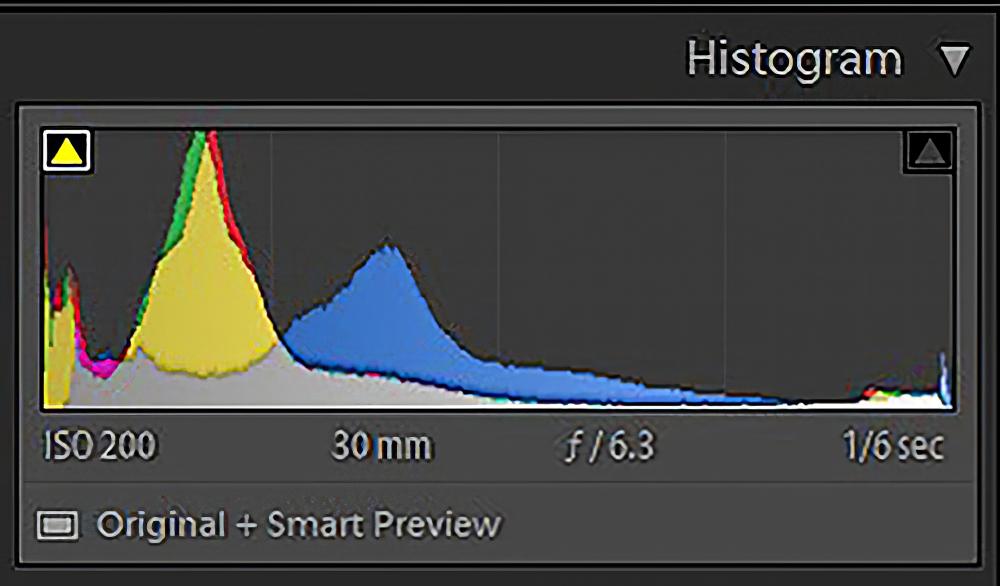
This is the in-camera histogram as I was taking the photo with normal exposure. Keep in mind that these are bright, translucent objects in a white set. It should look bright and airy. I use mirrorless cameras that are in full-time live view. They let me display the camera’s onboard histogram right in my finder. I think DSLRs can only display it in the review or live view. It’s nice to be able to see it in real-time. This camera histogram is very similar to its Lightroom histogram: crowded and spiked to the right, reflecting that the overall picture is very bright.
What About Underexposure?
Screenshot by Charles Haacker
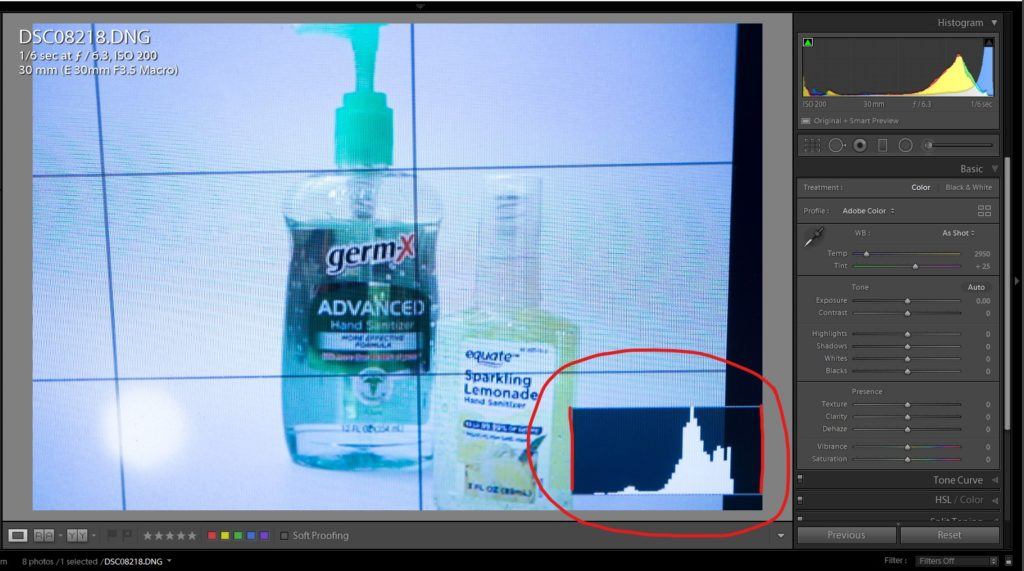
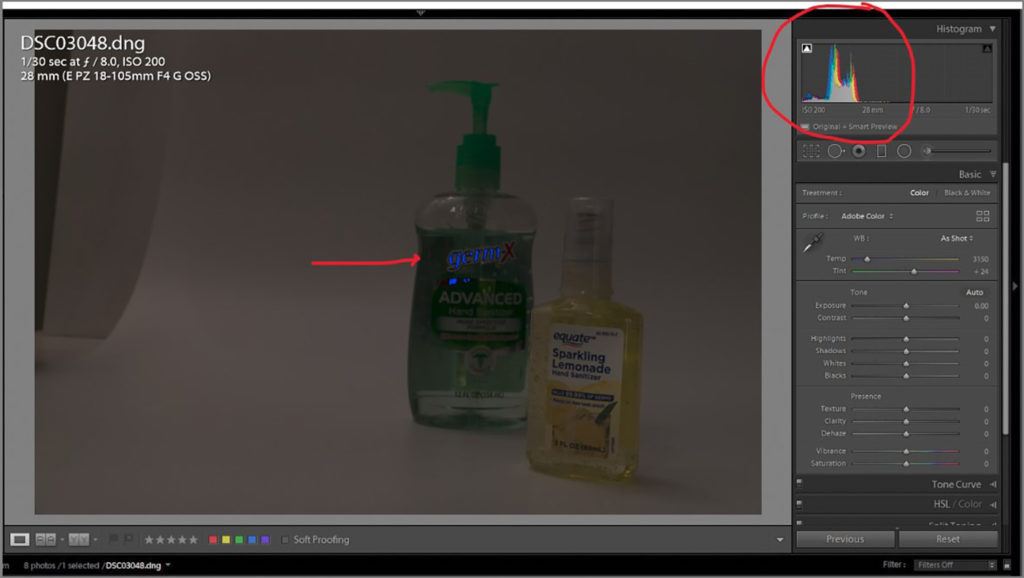
You can see underexposure when you review, but your histogram will verify that you may be underexposing if most of the tones are crowded and spiked at the left, dark end of the box. The red arrow points to the very-much clipped black text on the bottle.
But just as a perceived “too bright” histogram was accurate for a fairly high key setup, so can a perceived “too dark” histogram be perfectly accurate if the scene is low-key, with more darks than lights.
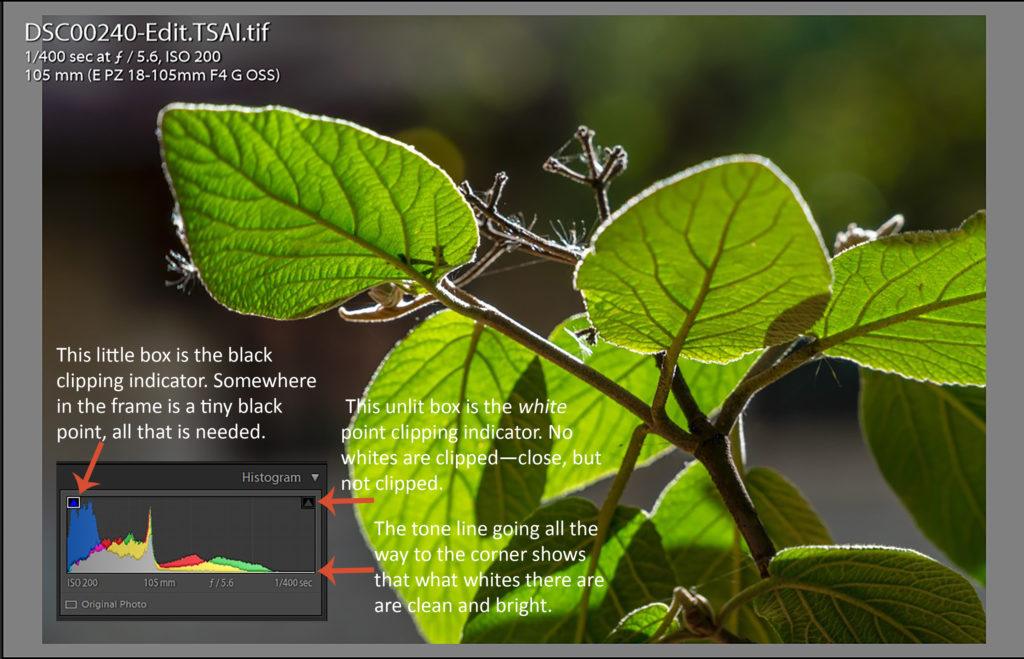
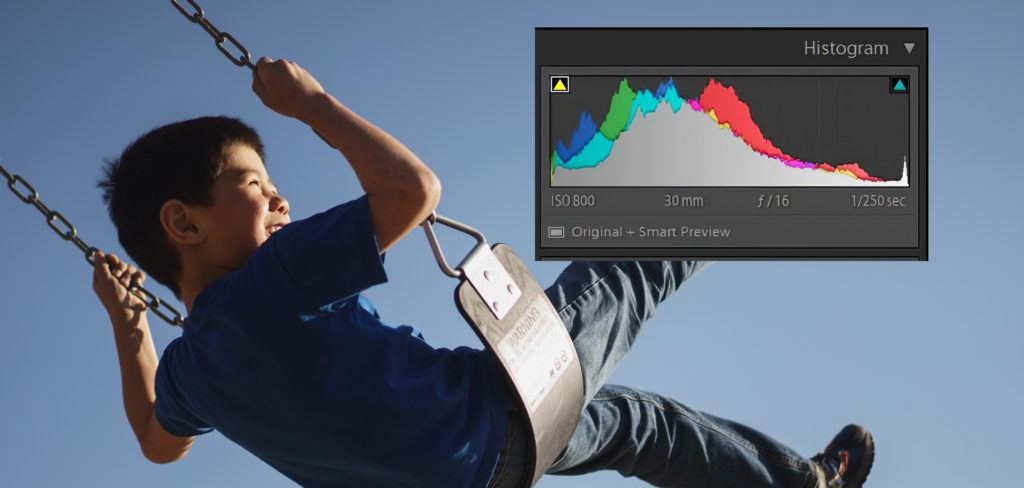
Illustration by Charles Haacker
This picture is relatively low-key. You can see that the picture is predominantly dark, which is reflected in the histogram. The tones are bunched against the left, dark wall of the box. There’s nothing wrong with the picture, and nothing wrong with its histogram.
Notice the shadow clipping indicator here is “lit.” It’s indicating that there is clipping in the deep yellows. The highlight indicator on the other end is not “lit,” but the tones go all the way from end to end, even spiking a little on the white end, verifying that there is a maximum scale in this picture of backlit summer leaves. Screenshot by Charles Haacker
Where Is the Histogram Most Valuable in Your Workflow?
Screenshot by Charles Haacker
I use and value the in-camera histogram at the point of exposure, but as a 100% RAW shooter, I find the best use for the histogram is in the dark lightroom during post-processing.
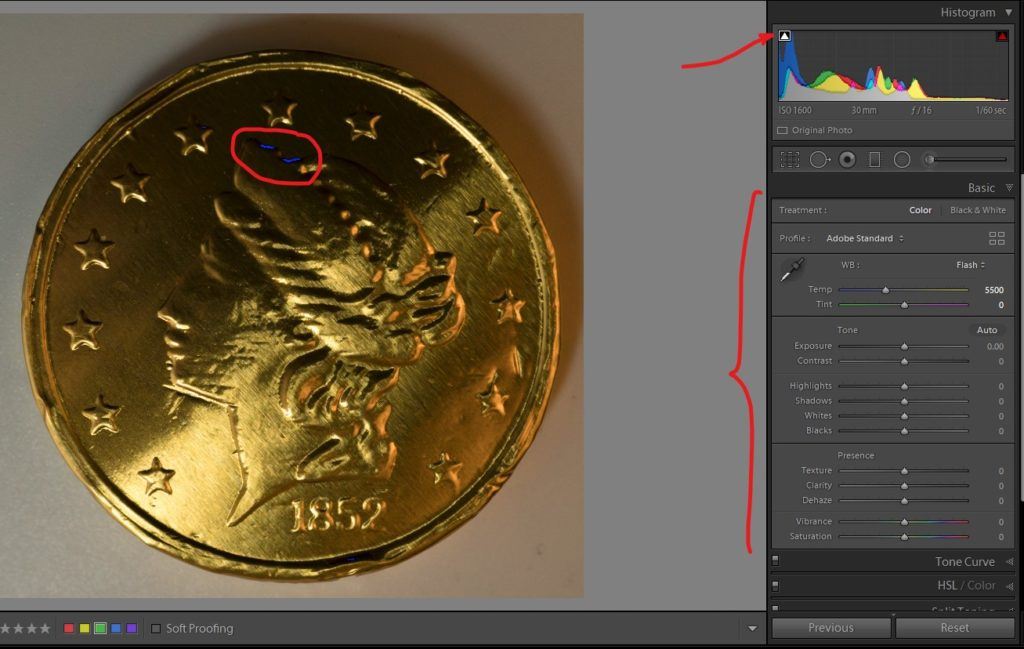
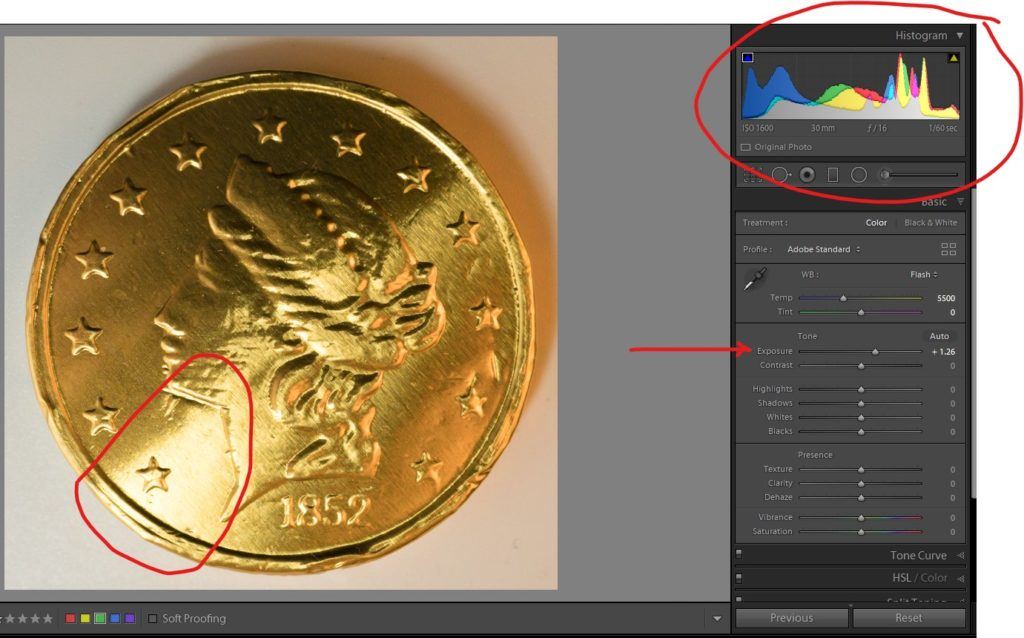
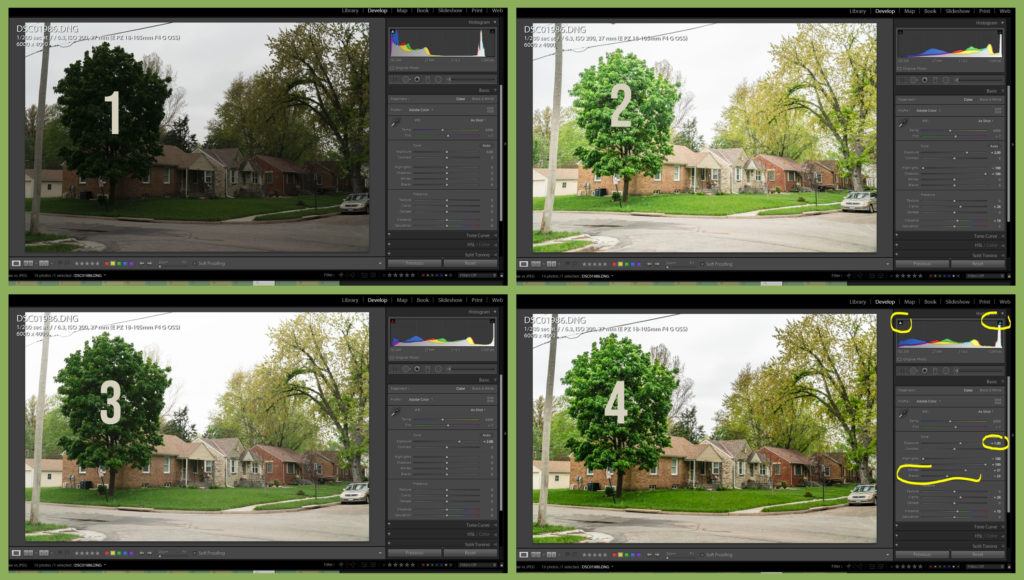
Step 1: I chose an unusual file – a brightly reflective gold Hanukkah chocolate coin – to show how the histogram helps me. I shot with a flash bounced off a low ceiling behind me. The circled blue squiggles are clipped shadows (my black point). The arrow in the upper right points to the clipping indicator. The bracket by the basic development module shows that no sliders are adjusted (the color temperature is at default). The exposure is zeroed, but a glance at the histogram shows that the overall tone of the picture is dark, as most of the tones are bunched to the left, dark end of the box.
Screenshot by Charles Haacker
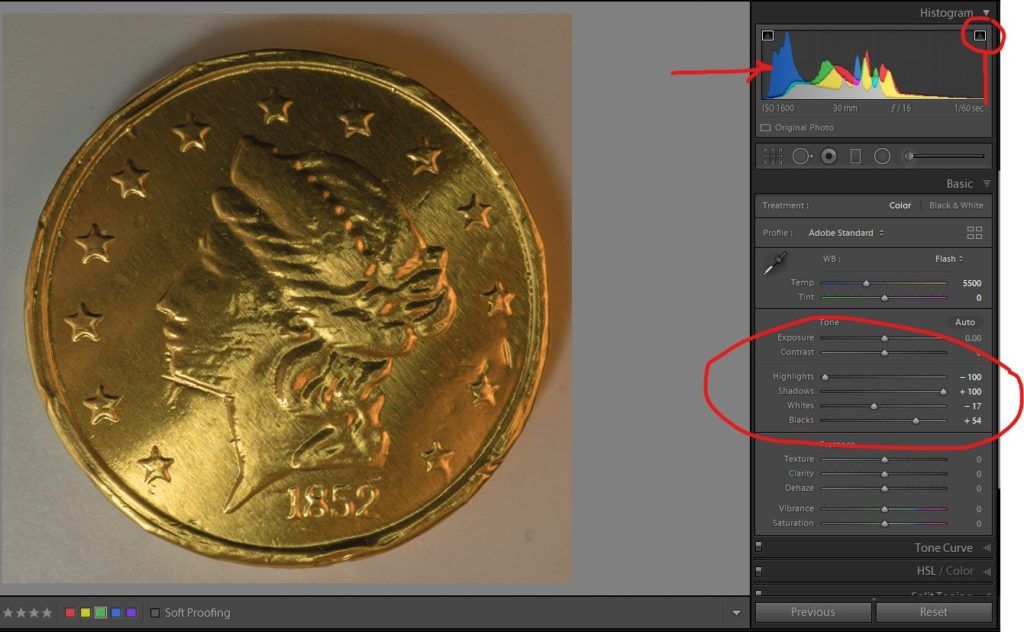
Step 2: I raised the exposure by 1-1/3 stops. The histogram is now nicely distributed across the full width of its box, but I don’t feel that the picture is improved; it is now too light and lacking in contrast. The circled area shows the brightest highlight is just shy of clipped. This shows that trying to adjust for the elusive “normal” histogram can be counterproductive. This is an atypical subject, and an atypical histogram reflects that.
Screenshot by Charles Haacker
Step 3: I returned the exposure to zero, but I made other adjustments in the Basic panel. I pulled the highlight slider all the way down to reduce them and pushed the shadow slider all the way up to open the shadows. I adjusted the black point to just short of clipping and took the white up also, but now it looks flat. Note especially that the histogram has returned to where it was in Step 1.
Screenshot by Charles Haacker
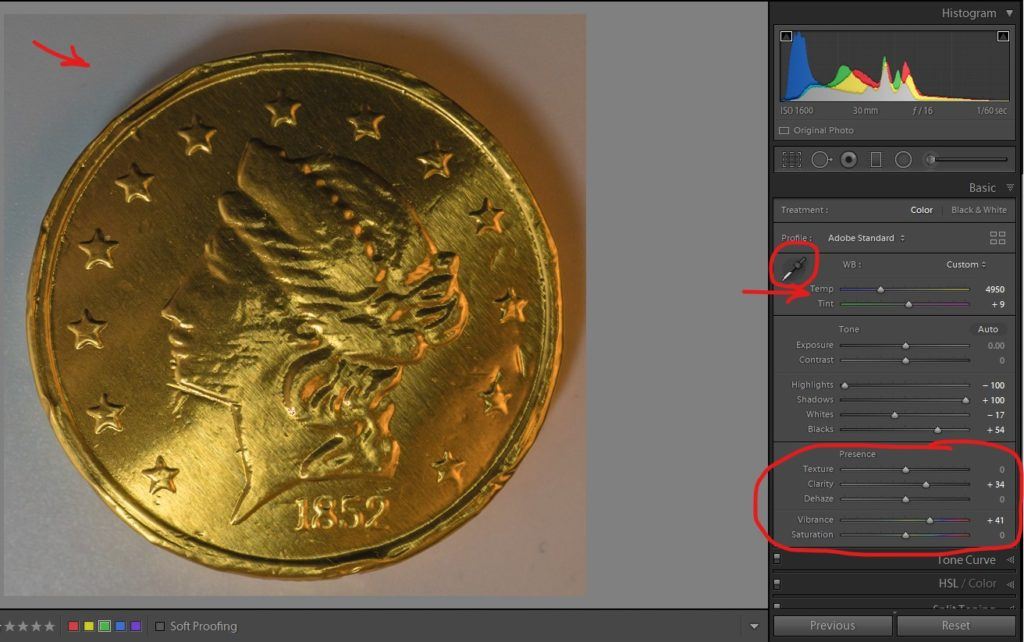
Step 4: I’ve adjusted the color temperature for a neutral gray by using the eyedropper where the arrow is at the upper left. The Presence panel (circled) has adjustments to give a little subtle contrast to the piece, but now I don’t care for the big shadow. The histogram has not moved.
Screenshot by Charles Haacker
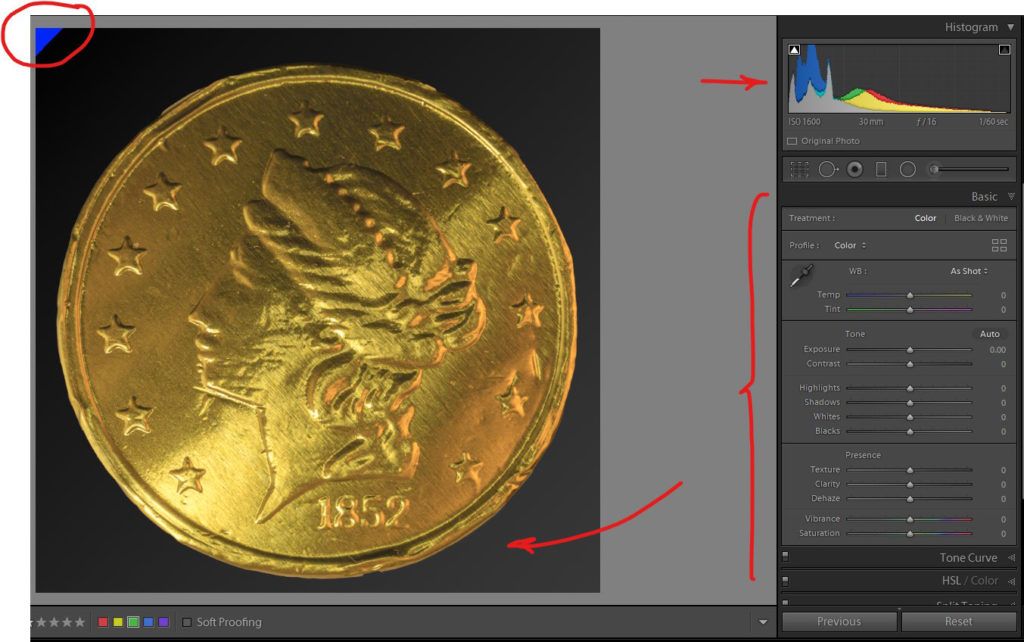
Step 5: Finally, the image has been taken into Photoshop to replace the original background with a dark gradation, from black at the upper left (see the blue clipping black point?) to a very dark gray at the lower right. The histogram has changed very little, and the bracket shows that since the original file was saved as a TIFF file, there are no new adjustments needed—every slider is zeroed.
(Yes, when I finished, I ate the gelt. Yum!)
Good, balanced exposure is always best practice, but we all mess up now and then. If you are a RAW shooter you might be surprised at how much good detail is retained in an apparently incorrect exposure.
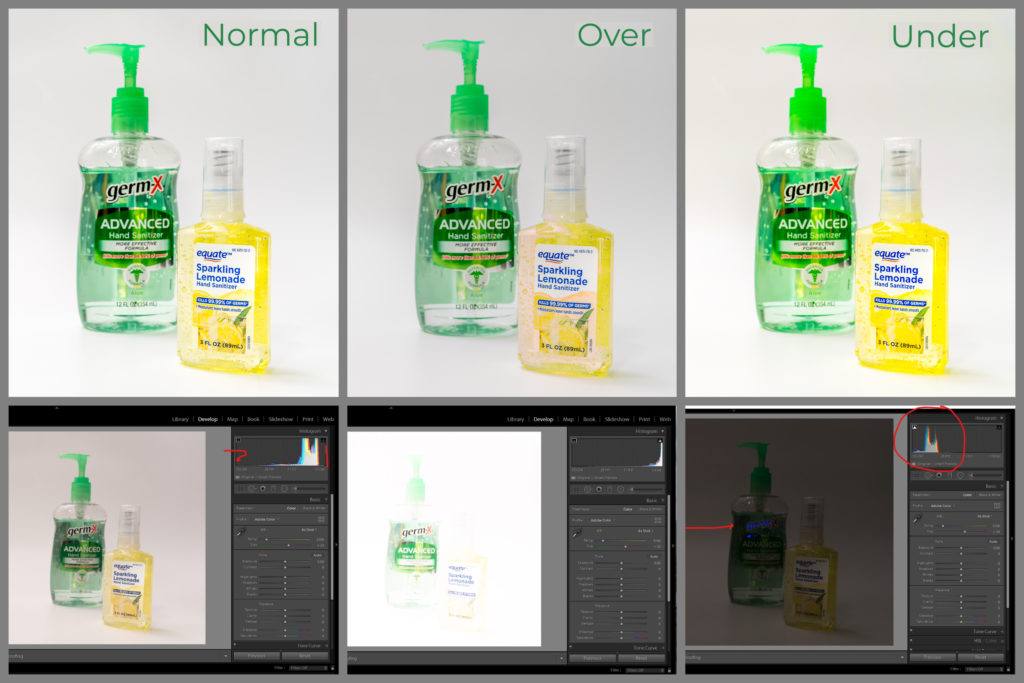
Screenshots by Charles Haacker
In the image above, the left frame is the balanced normal exposure; at the center is the formerly grossly overexposed frame, processed as much as possible to match the normal, within acceptable, limits. On the right is the formerly grossly underexposed frame. You can see the original histograms for each on the lower row. Badly overexposed images are not usually used, but RAW retains all the sensor data so you have some hope of getting something acceptable.
Conclusion
The histogram, whether in-camera or in post-processing, or both, is a valuable tool that helps you to get the best-balanced exposure. If you are shooting RAW (highly recommended), then you can use your in-camera histogram to help you ETTR, Expose To The Right—a deliberate overexposure allowed because you can “drag the highlights back” while maximizing shadow detail without increasing noise. You shouldn’t try that if you are shooting JPEG because overexposed highlights will block, but then you can use the histogram in your camera to help you avoid overexposure.
Good, balanced exposure is always best practice, but we all mess up now and then.
It’s not a Swiss Army knife that does everything but none of it well; it’s a helper, not a boss. Your first best tool is your good pair of eyes. Use your histogram(s), but you needn’t slavishly follow their lead. If it looks wrong, it’s wrong; never mind the histogram.
Photograph by Charles Haacker
Screenshots by Charles Haacker